Factories already produce enormous amounts of data. PLC tags, drives, vibration sensors, quality systems and maintenance records all describe part of the operation. Yet more collection does not automatically create better decisions. The difficult work is preserving signal meaning as data moves from the machine to the people and systems expected to act.
Begin with a decision, not a dashboard
A connected operations project should start by identifying a decision that is currently late, uncertain or expensive. Examples include recognizing a brief stop, detecting a developing bearing issue, explaining an increase in cycle time or identifying which operating state caused an energy event.
That decision defines the signals, time resolution, context and retention required. Without this discipline, teams often connect hundreds of tags and only later ask what the dashboard should reveal.
Who needs to know what, how early must they know it, and what controlled action should follow?
Match acquisition to the physical phenomenon
Slow process temperatures and production counts may be captured through existing control system interfaces. Vibration, acoustic emissions, current signatures and fast pressure events can require sampling rates far beyond normal PLC history. If the acquisition rate is too low or channels are not synchronized, the important event may disappear before analytics begins.
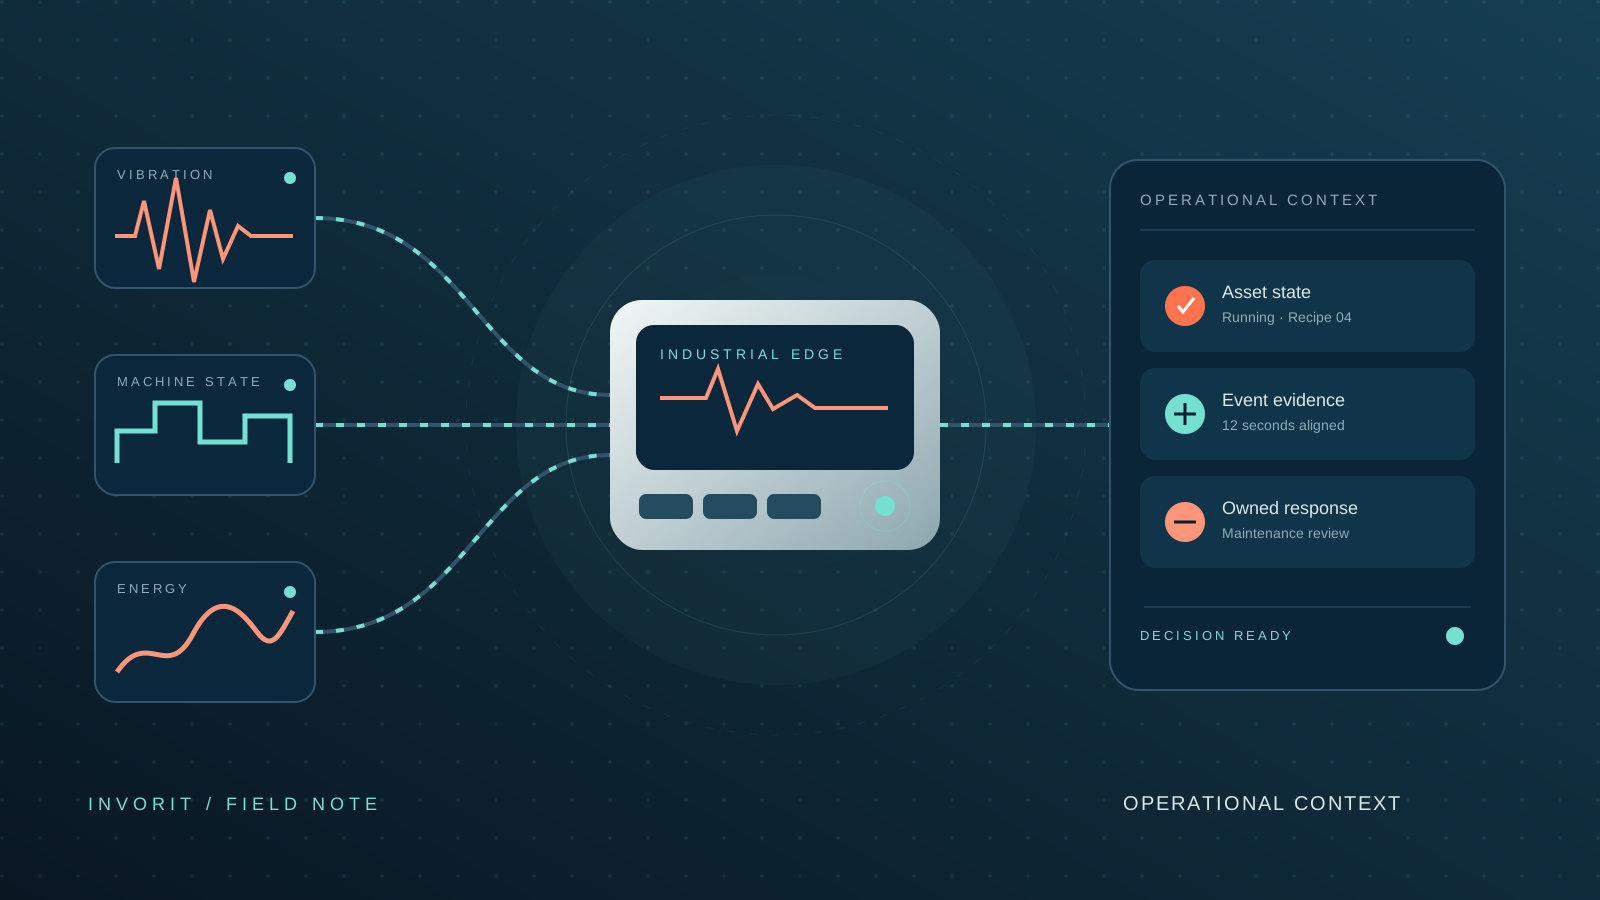
Edge acquisition places deterministic collection and initial processing close to the asset. It can buffer data during network interruption, calculate features, detect events and retain a detailed window around an anomaly. This makes upstream systems more useful without sending every raw sample indefinitely.
Time alignment creates evidence
A change in vibration has little meaning if it cannot be aligned with load, speed, product, tool position or a maintenance intervention. Reliable timestamps and synchronized channels make it possible to distinguish a genuine asset change from a normal operating transition.
An event record might include a short waveform captured at high frequency, calculated condition indicators, PLC state, active recipe and the seconds before and after the event. That package is far more useful for investigation than an isolated alarm or an aggregated daily average.
Context turns data into an operational model
Plant data is often organized by source: one historian for controls, another system for quality, a CMMS for maintenance and an ERP or MES for production context. Operational intelligence requires a shared model that describes assets, lines, products, orders, states and relationships.
The model does not need to become a perfect enterprise ontology before delivering value. It should begin with the entities required for the first use case and expand deliberately. A downtime event, for example, becomes actionable when it includes the machine state, duration, reason, product, shift and responsible workflow.
Analytics should explain enough to act
Thresholds remain valuable when physical limits are known. Statistical baselines help reveal drift. Machine learning models can combine multiple condition indicators or estimate risk. The right method is the simplest one that provides sufficient warning and an explanation the team can use.
A health score alone rarely tells a technician what to inspect. A better output includes which signals changed, under what operating condition, how the event differs from baseline, and what supporting evidence is available. Recommendations should connect to approved maintenance or production workflows rather than ending at a notification.
Close the loop and measure the response
An alert that nobody owns is only another data point. Connected operations creates value when insight enters a defined human or automated response: classify downtime, inspect an asset, adjust an approved parameter, create a work request or preserve evidence for engineering review.
The final measure is not how many tags are connected. It is whether the operation recognizes important conditions sooner, understands them with less manual correlation and responds consistently. That requires edge reliability, contextual data and workflow design to be treated as one system.